Project 3
|
|
Questions:
1. Describe how you created the map so others can repeat the process.
First, go to https://www.arcgis.com and click on “Map” on the top left. Once the next page comes up click on “Modify Map” in the top right. Click on the “Add” tab in the top left and the “Search for Layers.” Once you have reached this point search for “diversity” and then choose “2012 USA Diversity Index (Mature Support).”
First, go to https://www.arcgis.com and click on “Map” on the top left. Once the next page comes up click on “Modify Map” in the top right. Click on the “Add” tab in the top left and the “Search for Layers.” Once you have reached this point search for “diversity” and then choose “2012 USA Diversity Index (Mature Support).”
2. Explain the data included in this layer and its significance.
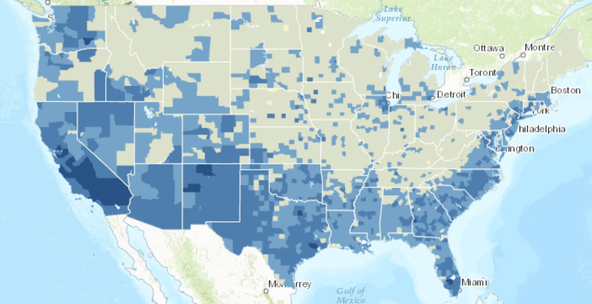
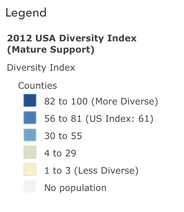
The data in this layer shows how likely it is for two random people in a county or state to be of different races. The darker the area, the more diverse it is. This is significant because it shows how diverse the melting pot of America is truly. It is also important to know as an informed voter to understand the makeup of the United States.
The data in this layer shows how likely it is for two random people in a county or state to be of different races. The darker the area, the more diverse it is. This is significant because it shows how diverse the melting pot of America is truly. It is also important to know as an informed voter to understand the makeup of the United States.
3. Identify and describe national trends that appear on this map.
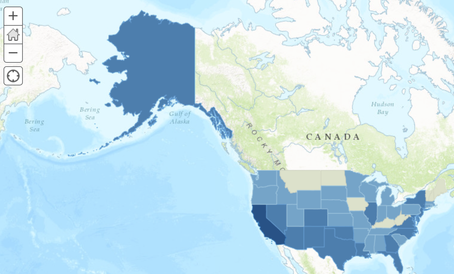
Areas near large cities have more diverse populations. The northern midwest and west have very low diversity. The southwest region has the most diversity over the largest area of land.
Areas near large cities have more diverse populations. The northern midwest and west have very low diversity. The southwest region has the most diversity over the largest area of land.
4. Select three counties and/or cities that surprised you. Why are these places more or less diverse than you expected?
I was surprised by the diversity in York County, PA because the section where my grandparents live has almost no diversity. There are also some counties in Texas, such as Llano County, that have very little diversity, but surrounded by counties with much higher diversity. I was also surprised by the lack of diversity in upstate New York. I figured the rural areas would have low diversity, but I thought counties like Erie County, which contains Buffalo, would have a more diverse population.
I was surprised by the diversity in York County, PA because the section where my grandparents live has almost no diversity. There are also some counties in Texas, such as Llano County, that have very little diversity, but surrounded by counties with much higher diversity. I was also surprised by the lack of diversity in upstate New York. I figured the rural areas would have low diversity, but I thought counties like Erie County, which contains Buffalo, would have a more diverse population.
5. How else could ArcGIS be useful for a high school?
ArcGIS could be used by schools to show the impact that history still has on the way our population is spread across the country. Doing this could also show students how diverse their community is compared to others in the United States, giving them greater perspective. Beyond school, this website could be used by students when searching for colleges so they can find a region that best fits their wants and needs. For example, if a student wants to study in a rural area they could place a population layer on the map and look for schools in regions with low population density.
ArcGIS could be used by schools to show the impact that history still has on the way our population is spread across the country. Doing this could also show students how diverse their community is compared to others in the United States, giving them greater perspective. Beyond school, this website could be used by students when searching for colleges so they can find a region that best fits their wants and needs. For example, if a student wants to study in a rural area they could place a population layer on the map and look for schools in regions with low population density.
