Project 2
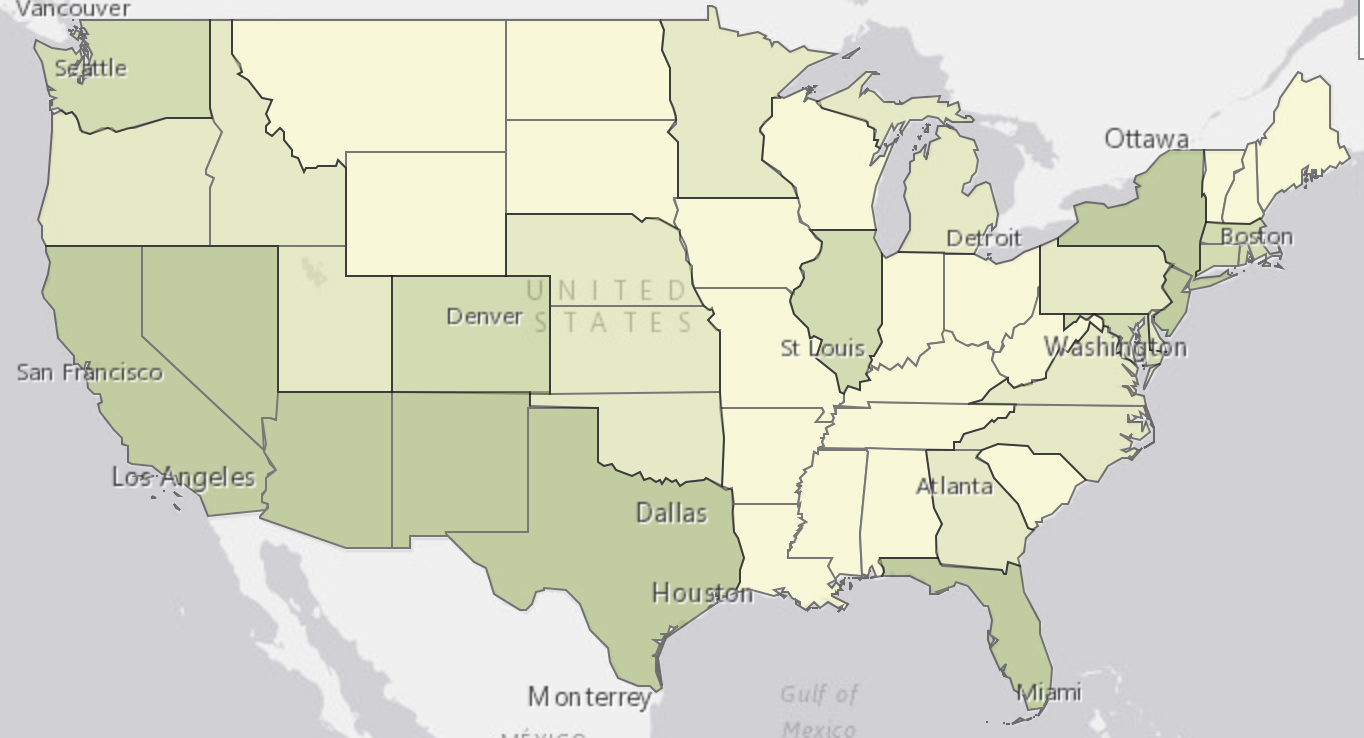
In this project, I examined map stereotypes. I thought that in the southwest region of the Unites States more people would speak a language other than english at home. To find this map I went https://factfinder.census.gov/faces/nav/jsf/pages/index.xhtml. I chose the Unites States in the Community Facts box. Then I chose the language and origin category and picked "Compare States for People who Speak a Language other than English at Home." I thought the Southwest would have the highest percentage because of the comparatively high number of immigrants from Latin America and Asia.
|
|
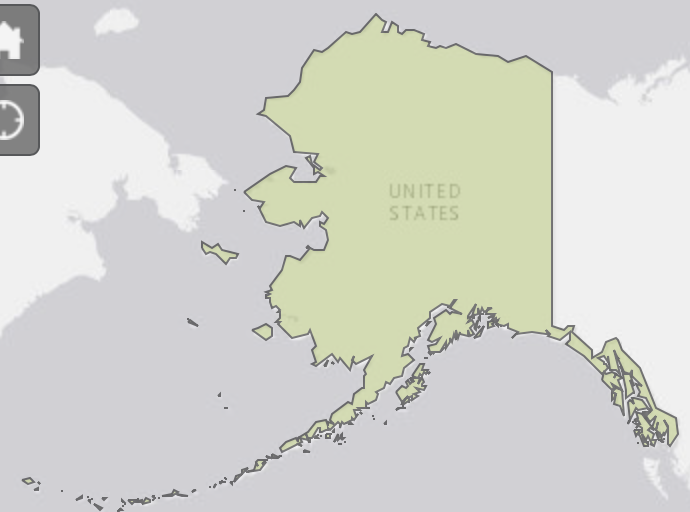
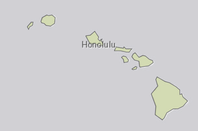
The southwest did have the highest percentage of non-english speakers at home. However, Puerto Rico has the highest number overall, since the native language of most Puerto Ricans is Spanish. Even though Puerto Rico is territory, not a state, I decided to include it since it has a higher population than some states. Something I was not expecting in the results was how high Illinois and New Jersey's number of non-english speakers at home.
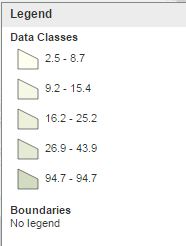
Choropleth maps can be manipulated by changing the gap between different colors to prove one’s point. For example, if someone wanted to show that an equal percentage of people speak languages other than english at home throughout the U.S., they could change the Data Classes to numbers lower than any state, one that included all states(2.5-94.7) and one with a larger percentage than any state or territory reached. This would make all the states the same color, so at first glance it looks like all states have similar numbers of non-english speakers at home.
When scale on a map is changed in can change the perseption of how far or close two locations are from each other. If the scale is very large, it would make it look like two things are very close to each other. On the other hand, if the scale is very small, it may look like the two points are very far away from each other. Although the map is not giving any false information, using improper map scale is deceiving to the reader.
The American FactFinder is useful to both public and private organizations. Public agencies could use this to tell where the areas are that they are most needed. For example, if the American FactFinder finds more people commute a certain distance to work from a certain area, they would work to improve the highways or public transit there. Private corportations could use American FactFinder to show tell where their target demographic is, or to which type of customers they should cater. The American FactFinder could tell a shopping mall developer where to build the mall, based on the income of different areas, and what type of stores to have, based on the area's age demographics.
